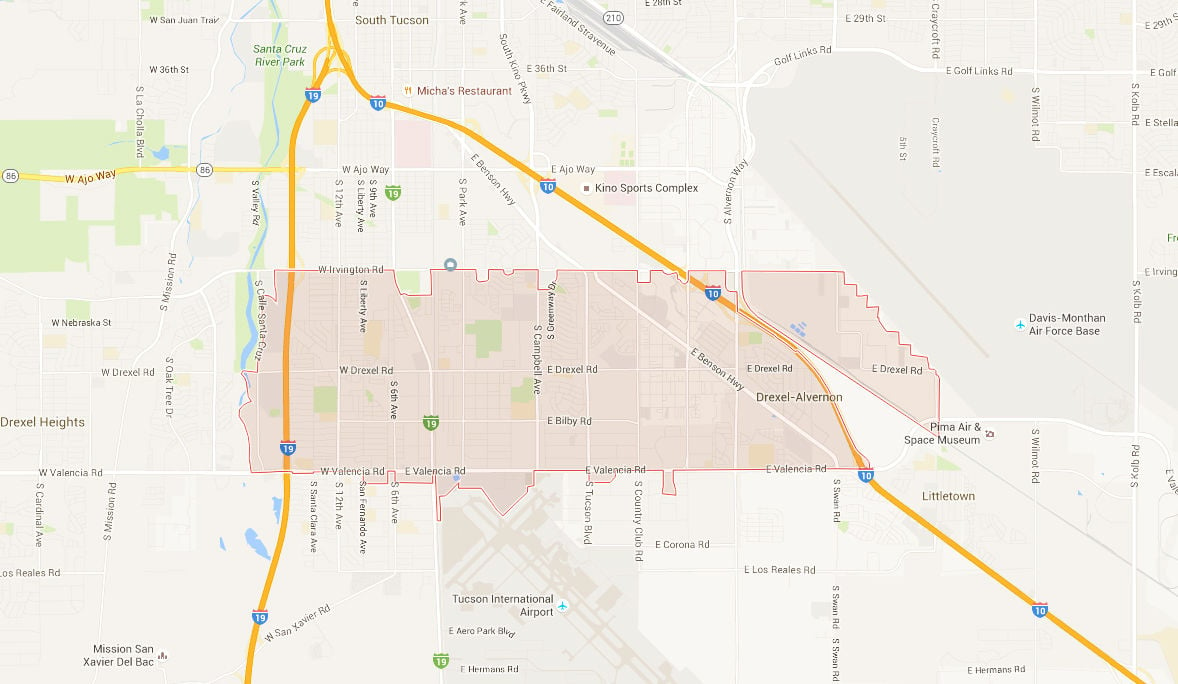
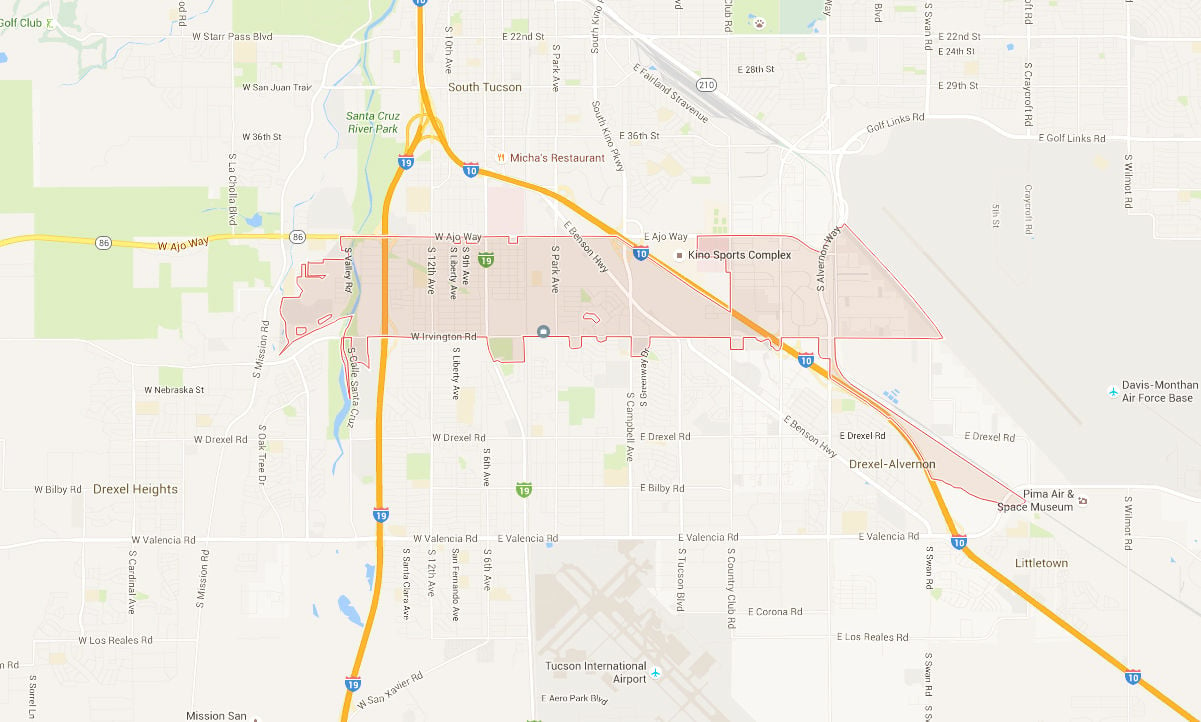
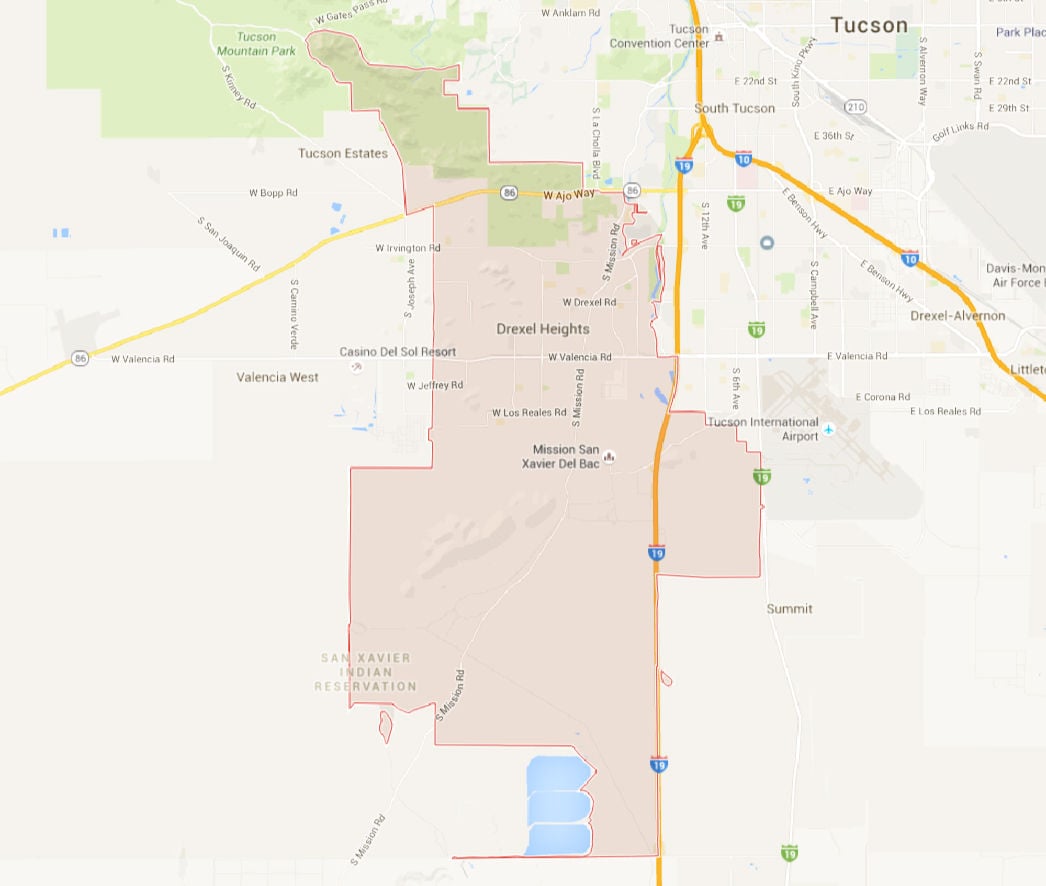
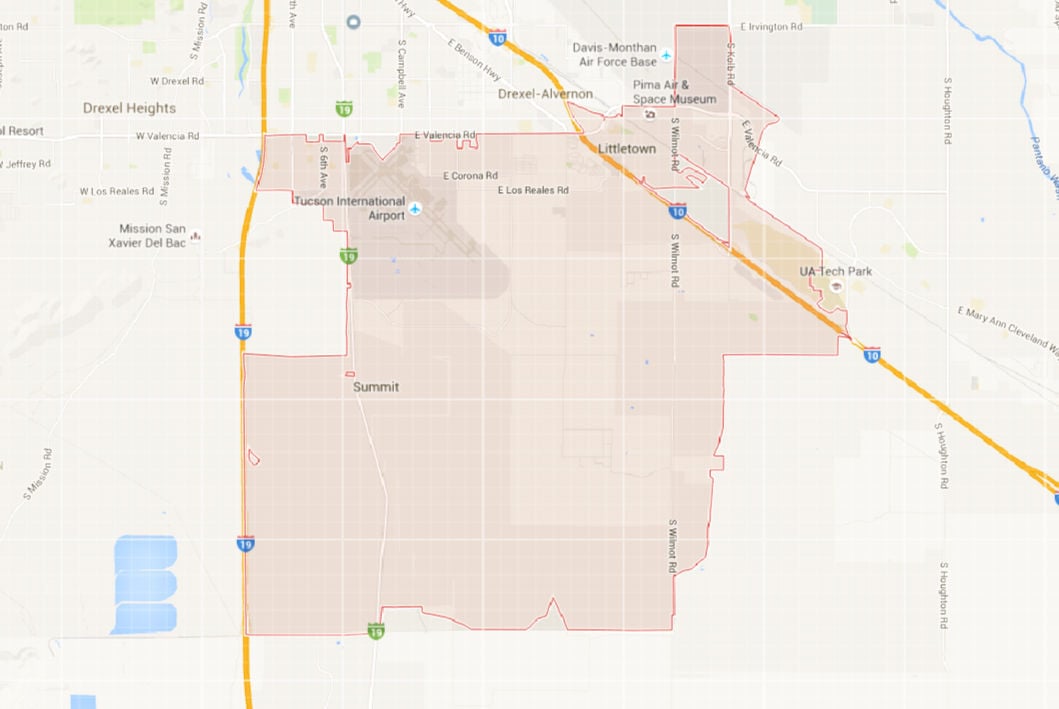
We took a look at the per capita (per adult) incomes in each zip code in Metropolitan ûÜÒøøÝýË.
Then we included home sale prices and rents to give the figures some context.
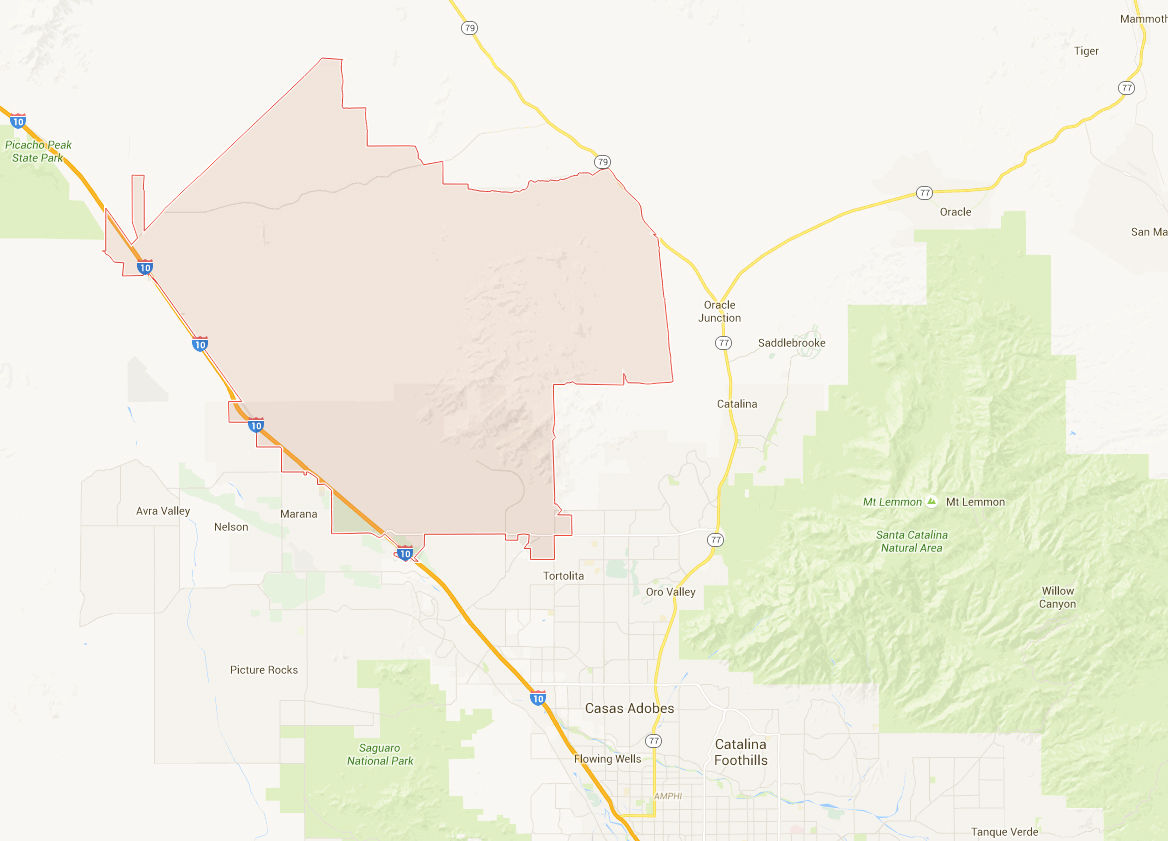
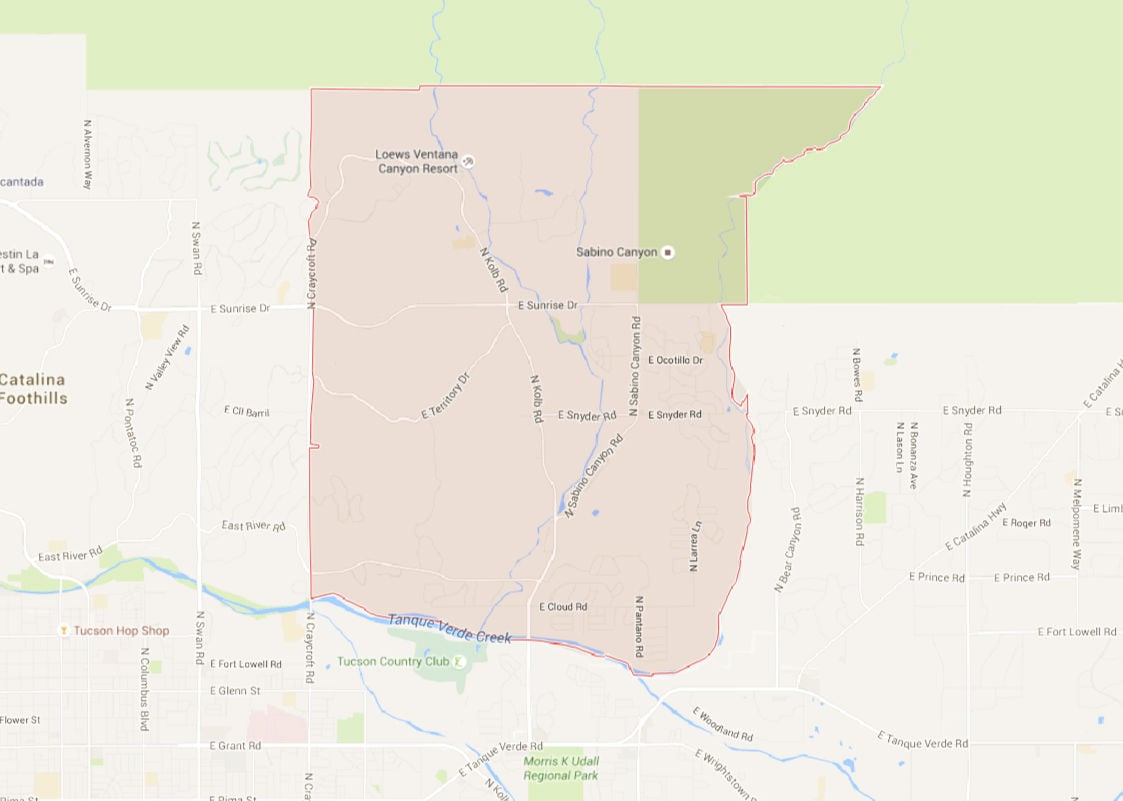
See how different areas of ûÜÒøøÝýË compare.
Here's an overall look at the area:
Low Income
Approximately 26.9% of ûÜÒøøÝýË Metro's population lives in a low income household, or a household with an annual income of less than $25,000. This is a high percentage of low income households for ûÜÒøøÝýË and the United States.
Lower Middle Class
The second most common household income level is lower middle class with approximately 26.4% of ûÜÒøøÝýË Metro's residents living in a household earning an annual income between $25,000 and $50,000.
Predominantly Own Property
Property in ûÜÒøøÝýË Metro is much more likely to be owned (61.8%), than it is to be rented (38.2%). This is a lower proportion of owned properties than ûÜÒøøÝýË (63.4%) and than the United States as a whole (64.4%).
A housing unit is owned if the owner or co-owner lives in the home, whether or not the mortgage is fully paid for. Homes not occupied by the owner, whether they are rented or occupied without payment, are classified as renter occupied by the American Community Survey.
Rent $500 - $1,000
Most rental units cost between $500 and $1,000 every month in ûÜÒøøÝýË Metro. This proportion of residents paying rent within this range is a higher percentage than ûÜÒøøÝýË and the United States.
These values refer to contract rent, as opposed to gross rent. Additional rent expenses or inclusions such as utilities, fuels, furnishings, or meals are not accounted for.